See you soon!
Showing posts with label infographics. Show all posts
Wednesday, 19 October 2011
just be inspired
I'm here to show some animations I watched lately (or maybe not). Enjoy them!
I've watched this a thousand times and I still laugh like the first one. Abbot and Costello are genius!
Another kinetic typographic work, now with my favourite quote form my favourite movie: The Devil's advocate and with my favourite actor: Al Pacino. I watched the movie more times that I'm willing to admit.
Do you want to know what I love about kinetic typographic works? When they're well done they enhance the qualities of what they're quoting. It's a marvellous thing to watch.
Etiquetas:
animation,
breathing [be inspired],
creativity,
design,
infographics,
inspiration,
old posts,
typography
Local: Porto, Portugal
Oporto, Portugal
Wednesday, 27 July 2011
twice!
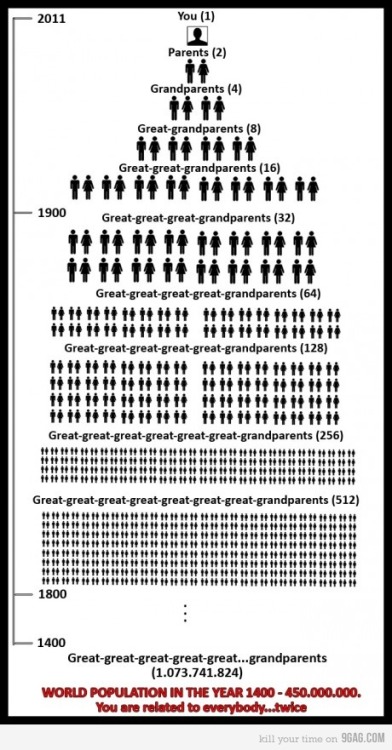
You know how I like infographics, they've everything to be cool: they're simple, beautiful, entertaining and informative. In a brazilian tumblr, named A tua mãe gosta* I found one so good that I had to share it.
* In English it means Your mother likes it. There's another blog with this name but with another author: it's from Alex Noriega, he's a comic artist and someday I'll post here some of his works. He has a blog called Stuff No One Told Me (but I've learned anyway) too.
Have a great day!
* In English it means Your mother likes it. There's another blog with this name but with another author: it's from Alex Noriega, he's a comic artist and someday I'll post here some of his works. He has a blog called Stuff No One Told Me (but I've learned anyway) too.
Have a great day!
Etiquetas:
creativity,
graphic design,
infographics,
old posts
Tuesday, 15 February 2011
hot data
| Fancy Drinks by Fabio Rex (Brasil), via Visual News |
For those who don't know what an infographic is, I'll explain:
An infographic is a visual representation of information, data and/or knowledge arranged in a chart form. Usually the information contained in an infographic is complex, but the reader reads it in a quickly and clearly way. The infographic may result from a combination of photography, drawing and text.
In an infographic there's no subjectivity, because we are transforming "cold data" (quantifiable data), as Alberto Cairo name it, into "visual data". See some cool examples:
| Periodic Table of Typefaces, via Six Revisions |
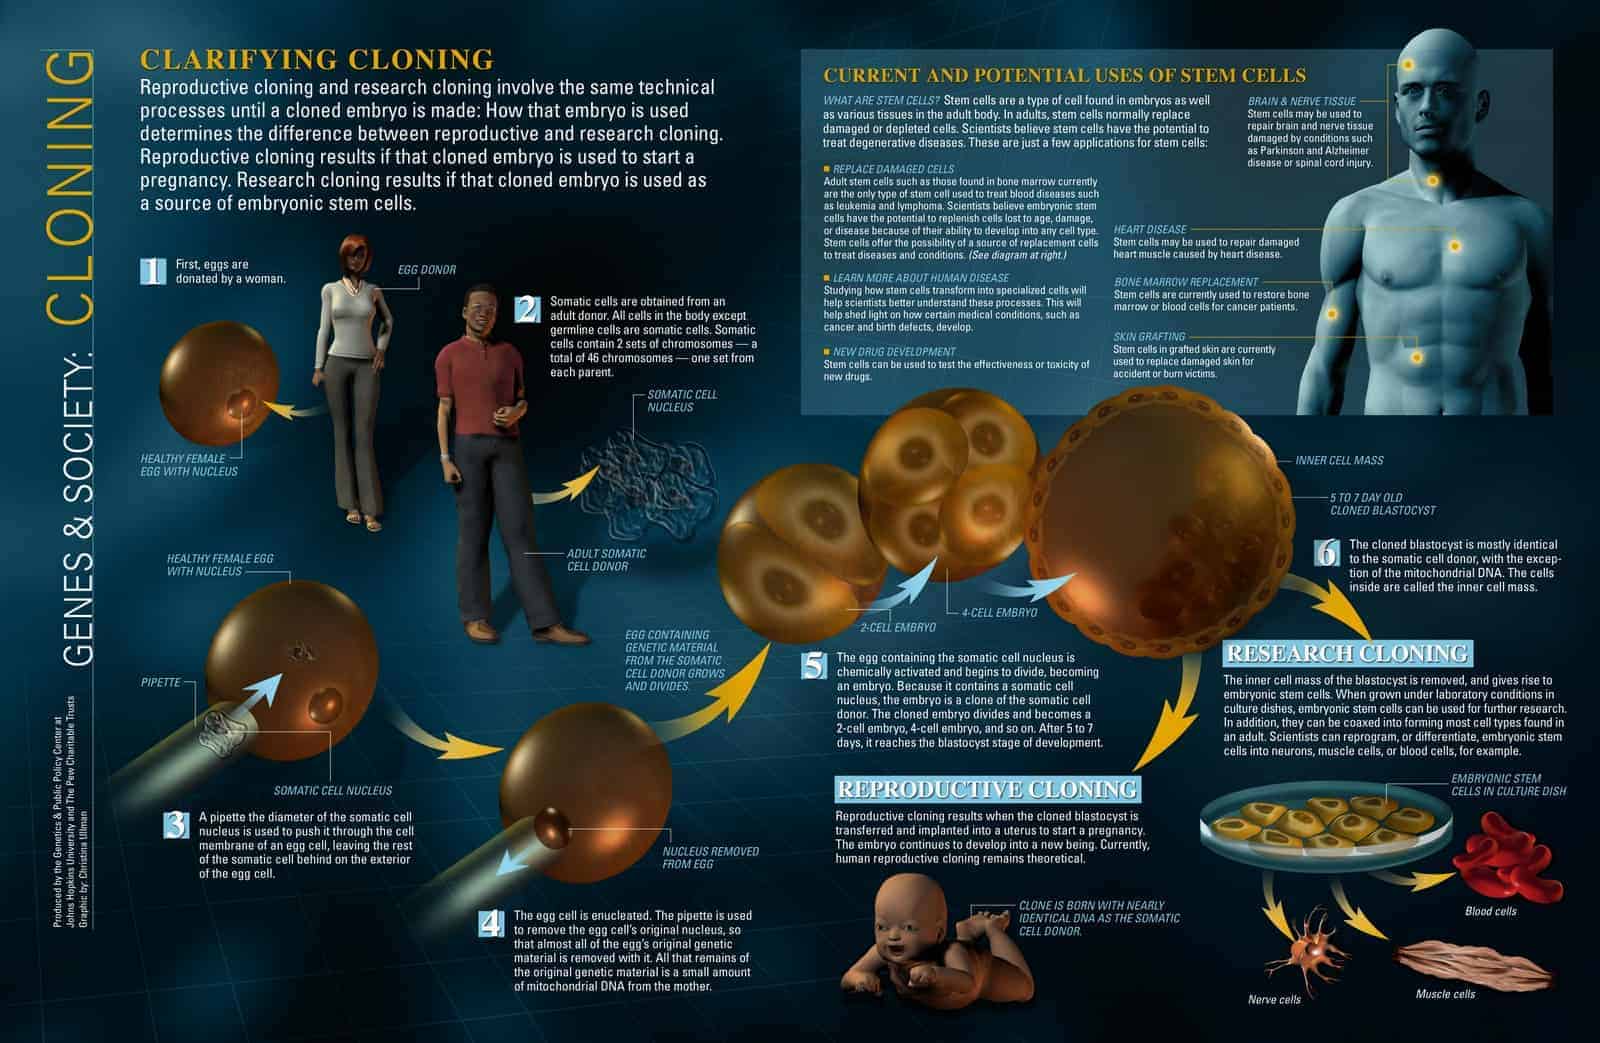
| Cloning, via Daily Infographic |
| The Most Polluted Places in the World, via Daily Infographic |
What's your favourite data?
Etiquetas:
design,
graphic design,
infographics,
inspiration,
old posts
Subscribe to:
Posts (Atom)