Tuesday, 22 February 2011

The world as a kid

Sometimes life isn't as good as we would like it to be, but there is always something we can do to brighten up our days.

Pierre Diaz is one of that persons that makes everything sweeter. Let's check out is dreaming world with fascinating illustrations.


What things did you imagine as a kid?

Friday, 18 February 2011

Thursday, 17 February 2011

dry icons

Lovely Tree by Dry Icons

Dry Icons is a site that shares free and paid vector graphics. Both have high quality in drawing and creative skills.  They have icons, wallpapers, website templates and so on.

They're my inspiration and push me to become better and achieve designs like that. Take a look:

Wanna Tweet by Dry Icons

Stylissimo Template by Dry Icons

Medical Icon Set by Dry Icons

Message Box by Dry Icons

Wednesday, 16 February 2011

we're gonna make it better

This is a beautiful animation about typography. It shows us the possibilities of text: we only need to be open-minded and creative.

Make it better was directed by Climent Canal and the animation is from Sebastián Baptista. He's Uruguayan, but living in London, and has a great talent.


Make it better from Sebastianbap on Vimeo.

(via design you trust)

Tuesday, 15 February 2011

hot data

Fancy Drinks by Fabio Rex (Brasil), via Visual News

For those who don't know what an infographic is, I'll explain:

An infographic is a visual representation of information, data and/or knowledge arranged in a chart form. Usually the information contained in an infographic is complex, but the reader reads it in a quickly and clearly way. The infographic may result from a combination of photography, drawing and text.

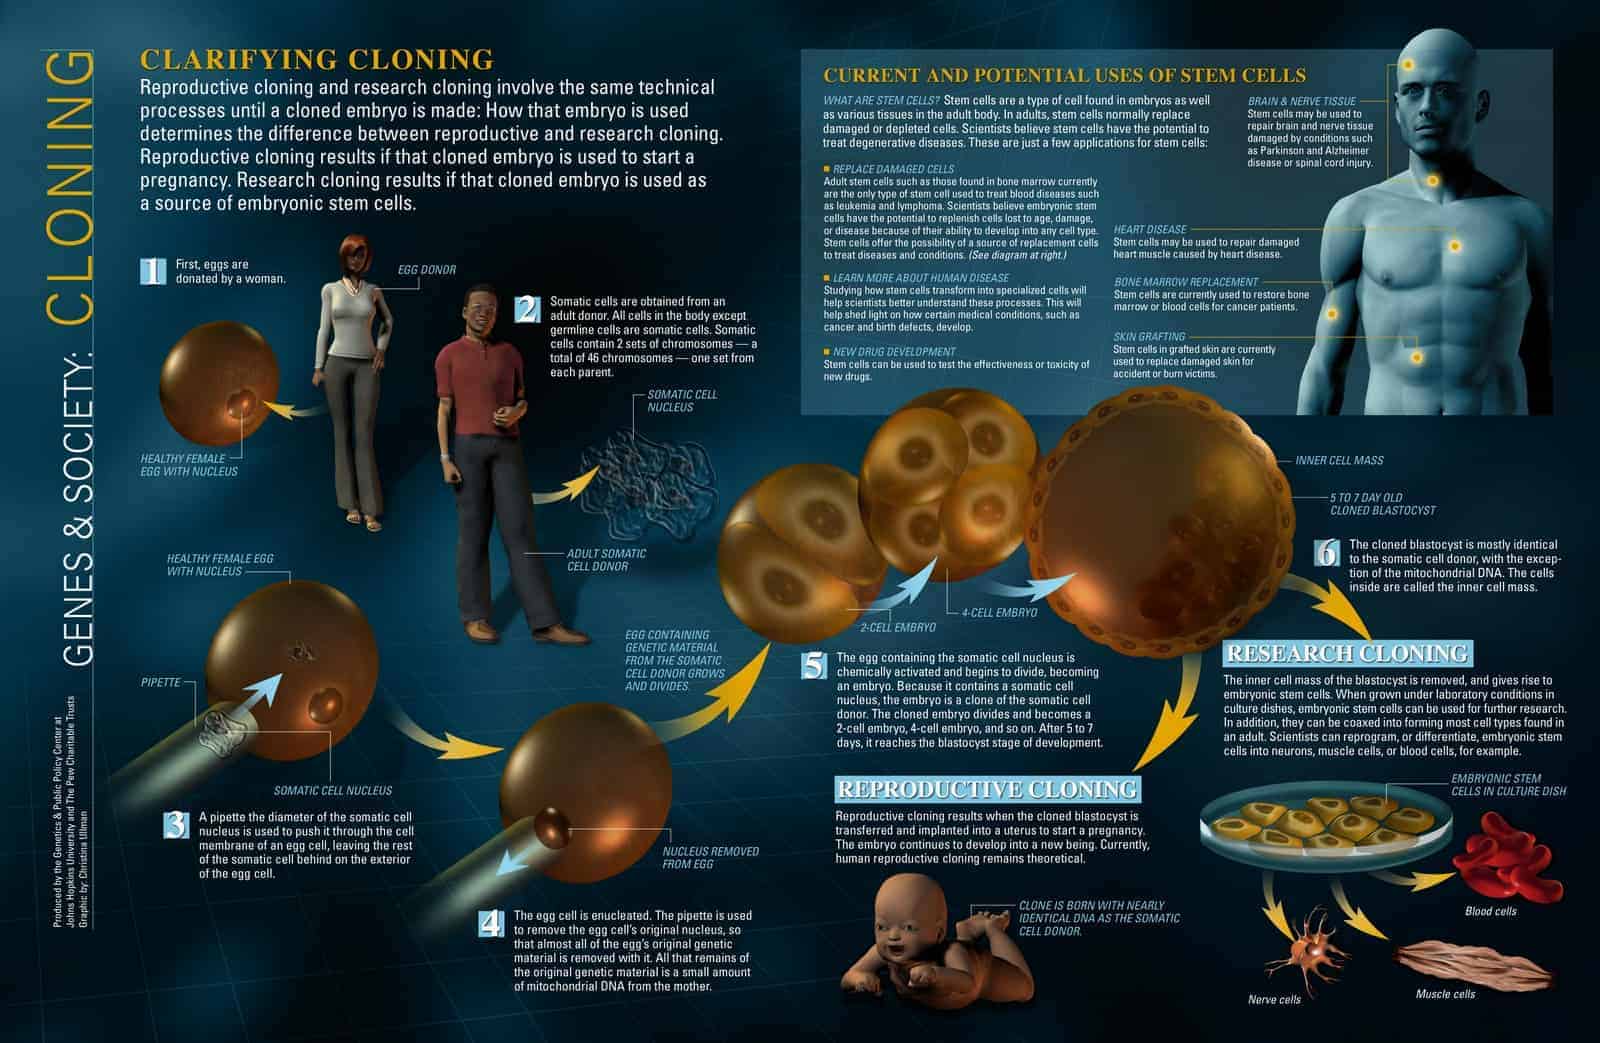
In an infographic there's no subjectivity, because we are transforming "cold data" (quantifiable data), as Alberto Cairo name it, into "visual data". See some cool examples:

Periodic Table of Typefaces, via Six Revisions
Cloning, via Daily Infographic

The Most Polluted Places in the World, via Daily Infographic
As you can see, infography can be used in a lot of places: newspapers, statistics, manuals, product design, etc.

What's your favourite data?

Link Within

Related Posts Plugin for WordPress, Blogger...