
 |
| Fancy Drinks by Fabio Rex (Brasil), via Visual News |
For those who don't know what an infographic is, I'll explain:
An infographic is a visual representation of information, data and/or knowledge arranged in a chart form. Usually the information contained in an infographic is complex, but the reader reads it in a quickly and clearly way. The infographic may result from a combination of photography, drawing and text.
In an infographic there's no subjectivity, because we are transforming "cold data" (quantifiable data), as Alberto Cairo name it, into "visual data". See some cool examples:
 |
| Periodic Table of Typefaces, via Six Revisions |
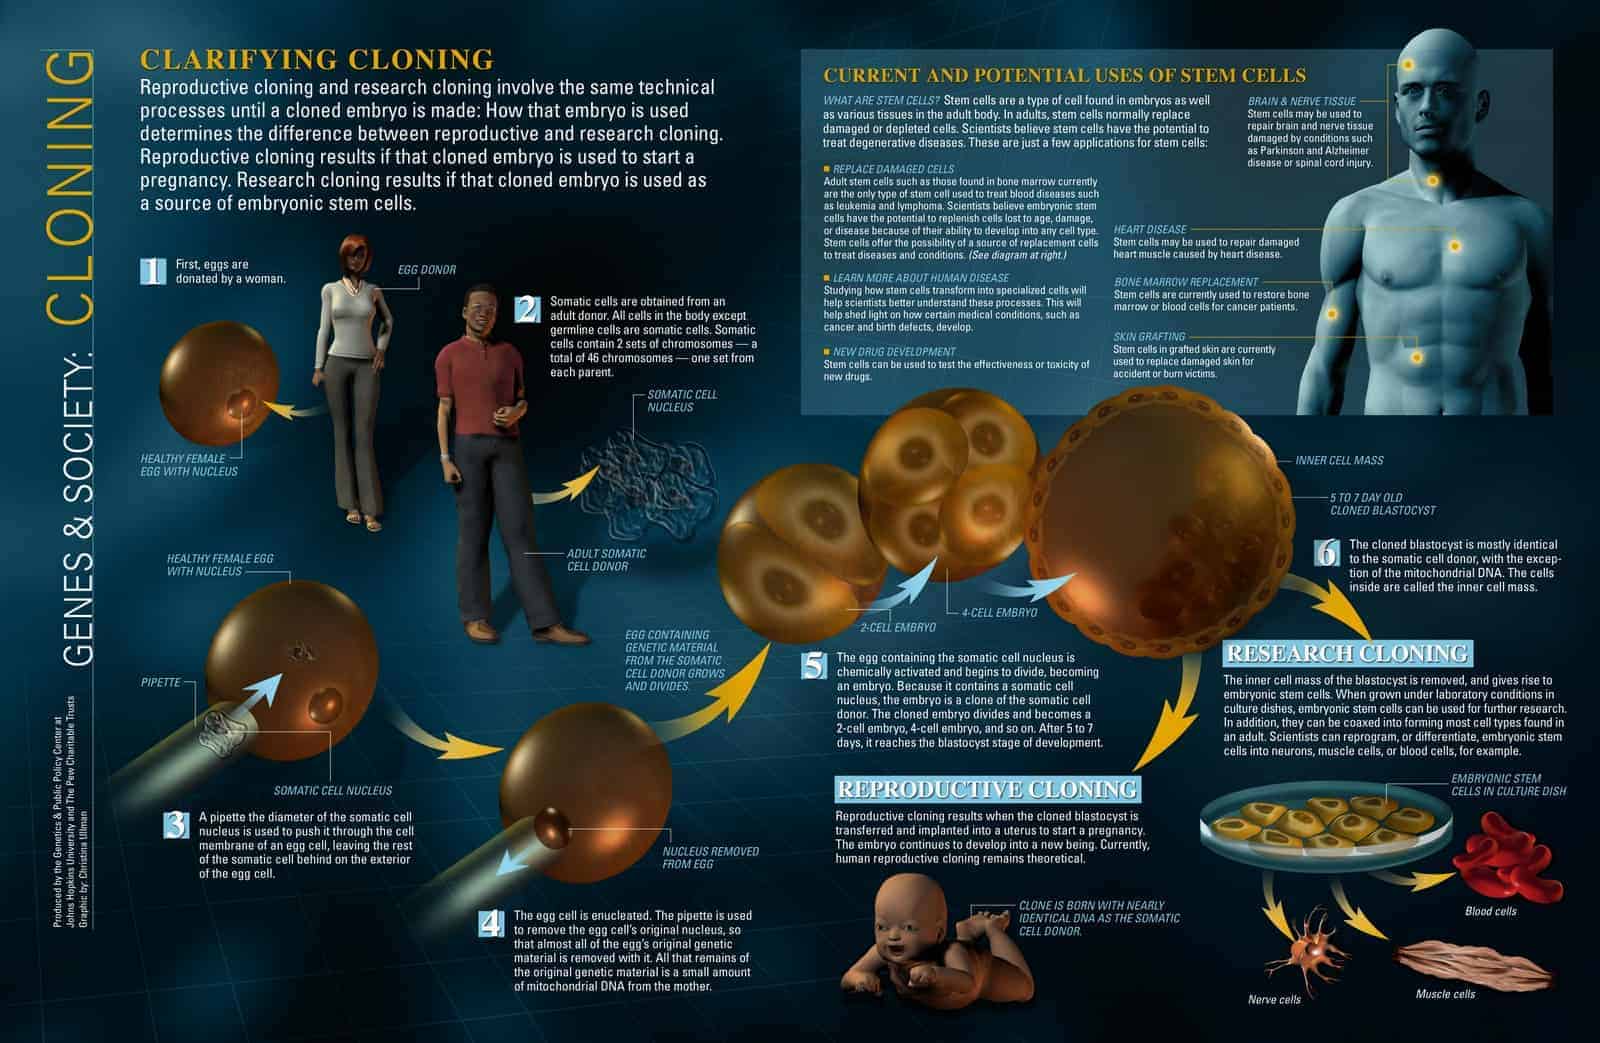 |
| Cloning, via Daily Infographic |
 |
| The Most Polluted Places in the World, via Daily Infographic |
What's your favourite data?
2 comments:
Love the first image.
The best thing is that it's useful and our drinks become much better. :D
Post a Comment